


The halfway point of a season is pretty darn good time to have a healthy look at things both good and bad on a hockey club.
The sample size is approaching somewhat trustworthy levels, and the midpoint of anything is certainly as good a time as any to hit the refresh button on things hurting a hockey club.
It won’t come as a surprise to any one that the Calgary Flames have struggled on the powerplay this season, but what do the numbers say when you drill down into situations, timelines and trends?
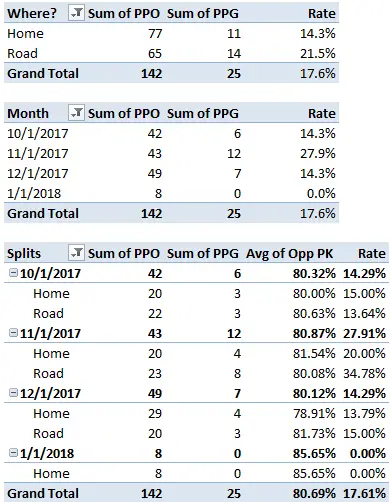 The Flames powerplay has been better on the road than it has at home this season. The club has scored 11 goals in 77 chances at the Saddledome (14.3%) and 14 goals in 65 chances (21.5%) as a record in every other rink. Three more goals in 12 less chances for 7% more efficiency isn’t insignificant.
But why?
Most of it has to do with time
The Flames powerplay was on fire in November, but has been pretty poor both before and after the 11th month of the year.
It just so happens that the Flames had a lot of road games in November, so the boost on the road is largely reflective of that 30 day period midway through the first half of the season. November hosted 35% of the road powerplays to date this season, where the team went 8/23 for 35%, while only 26% of the home powerplays where the team went 4/20 for 20%, their best home month of the campaign in conversion terms.
Maybe the team has faced tougher PK units at home than they have away from the Dome?
The opposite actually, but to be honest it’s negligible
The combined penalty kill rate of all the teams they’ve faced at the Saddledome this year is 80.6%, while on the road they’ve faced powerplays that summarize to 80.8%.
Nothing to see there.
But forget home and away, have the Flames faced stronger penalty killing teams in the first half than they will in the second half?
Nothing to see there either
The Flames faced an average PK unit of 80.7% in the first half and they will face a combined average of 80.8% in the second half; microscopic!
Sure but these things get pretty tight when you look at 41 games against 30 different opponents, is there a better way to look at this?
Now maybe we’re on to something …
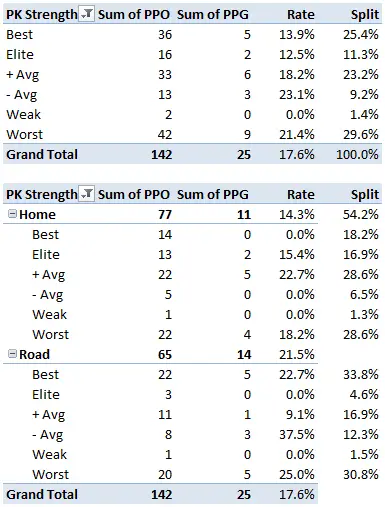 The Flames have faced the best grouping of penalty killing units (top 5) in 25.4% of their powerplays, which is high as there are six groups suggesting an estimate would be closer to 17%.
In splits they have faced above average kill units 55% of the time on the road, and 64% of the time at home, so you’d expect to see that road percentage a little higher all other things being held equal.
But I thought you said the first and second half are pretty much equal, how can that be?
It all comes down to the unbalanced schedule
Things don’t get easier because the first and second half both have unbalanced schedules, and the West has 10 of 15 teams above the average point of NHL penalty killing records compared to the East which has only 6 of 16.
In general a powerplay in the West won’t be as good as a powerplay in the East because they are playing tougher penalty killing units.
Or conversely, in true chicken or the egg fashion, maybe the PK units are great because the West has a collection of terrible powerplays.
So the powerplay just sucks then?
The easy answer is yes, but some other numbers suggest otherwise
Powerplays are a microcosm of professional sports themselves; its all about the results. How many times did you score compared to how many times you had the man advantage. The powerplay rate has been quoted in hockey games from the first game I watched on Hockey Night in Canada when I was six.
But in today’s world you can dig a little deeper and look at scoring chances.
First lets look at some numbers.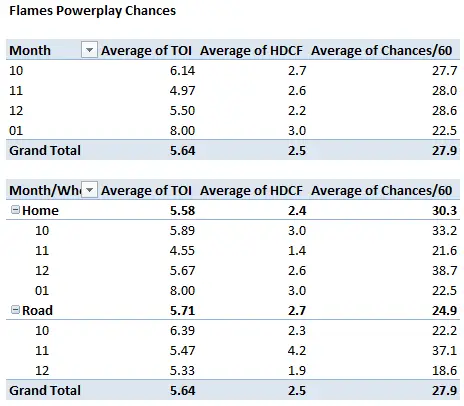
The average hockey game features roughly 10.7 minutes of powerplay time split between two teams for an average of 5.35 minutes or 2.67 powerplays per game.
The average team generates just over two high danger scoring chances in these 2.67 powerplays which is a drill down from the macro number of 22.4 scoring chances per 60 minutes of powerplay time per team.
Additionally, the average NHL team converts a powerplay to a goal 19.13% of the time which suggests the average hockey team will score a powerplay goal every 1.94 games after generating 3.9 powerplay scoring chances.
The Flames generate 27.9 high danger scoring chances per 60 minutes of powerplay time, which is ranked 6th in the National Hockey League.
When you compare each team’s ranking in terms of high danger chances and their effectiveness on the powerplay, the Flames give up 14 spots, which is the second worst differential in the circuit behind the Florida Panthers.
So the Flames are really unlucky then?
Maybe, maybe not
Yes that answer is a cop out, but it pretty much has to be.
First off the team at the other end of the table, the club with the worst differential between chances and powerplay success is the Nashville Predators, and they’re pretty good.
The Flames are, as I said, at the 2nd place position behind Florida, and joined in the unlucky group by Buffalo, Edmonton and Carolina – clearly not a murderer’s row of dominant hockey teams to be associated with.
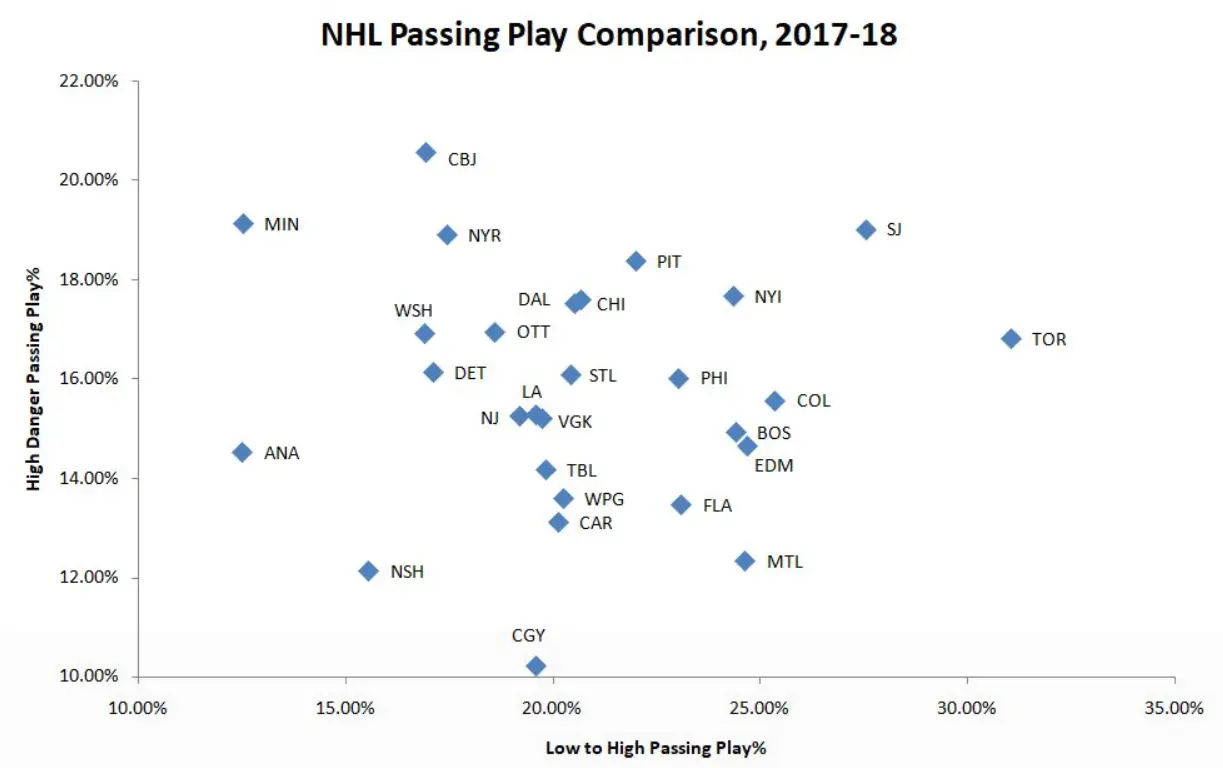 Corey Sznajder offered up an interesting look at passes to set up high danger chances in all situations that suggest the Flames are low on the totem poll for passing the puck into the home plate section of the ice, which could suggest it’s easier to defend against a team that has a tendency to walk in and shoot rather than move the defence with a quick pass.
A quick look to the right shows the Flames at the very bottom of the chart with just over 10% of their high danger chances coming off the pass in all situations.
That’s pretty damning.
So they do suck then?
Not so fast as the plot thickens
The Flames sit 13th in the NHL in shots on goal, but 1st in the league for shots that miss. Combine the two and you get the team ranked 7th for shots and misses combined (all but blocked shots in shot attempts).
They are 1st in crossbars, 5th in goal posts, 4th in shots that miss the net high, and 1st in shots that miss the net wide.
When you look at the other clubs that sat in that above unlucky ranking you will find the Oilers in a similar predicament, but the Hurricanes, Panthers and Sabres are a mixed bag in the rankings and not as nestled at the top as the Flames are.
To be high in chances but low in execution is an interesting predicament.
If you don’t get chances you have little chance of scoring as teams with terrible powerplays like Chicago, Columbus and Ottawa can claim. Those teams have talent but clearly they’re not getting in the areas required to score goals.
If you do get chances but you don’t score it has to come down to one of two things; a) a lack of finishing players or b) some bad luck.
It doesn’t take a huge reach to suggest a core with several youngish players may be struggling in finishing blue chip chances due to a need to try the perfect shot rather than just “Brett Hull” the heck out of it and fire at the middle of the net.
I’m not on to suggest the eye test has me thinking the Flames are dangerous with the man advantage, but there is something in the numbers that suggest it could improve soon.