


It takes a wise man to admit he was wrong. It takes a less than humble man to call himself wise, but then I digress.
The bottom line? I was wrong. Two years ago the whole world, well not the whole world, but the world of analytics predicted the Calgary Flames would come crashing back to Earth after their surprise 2014-15 return to the Stanley Cup Playoffs.
The team was relying too much on shot blocking shots, and not enough on driving the play themselves. The argument would go that a team can get lucky for a small stretch of time, even a whole season as it turned out, but in the long run all roads lead back to averages, and the Flames were going long on their luck withdrawals.
At the time I wasn’t a fool; I could see the shot blocks and the collapsing down low, but I guess part of me though Bob Hartley had figured something out. You take away the clear shot, and then counter with an even more dangerous transition and you could beat those corsi odds. They did for a season. They didn’t the next season when the opposition a) had more luck and b) took away the Flames stretch pass counter attack leaving them without answers.
So what has changed?
Essentially it’s a tale of three seasons, two under Bob Hartley and one under Glen Gulutzan. By now we’ve all seen the graph below showing Calgary’s 5 on 5 shot attempts (corsi) over three seasons. The first section shows the improbably 14/15 Flames, the middle the last year of Hartley 15/16, and the one on the right the first season under Gulutzan.
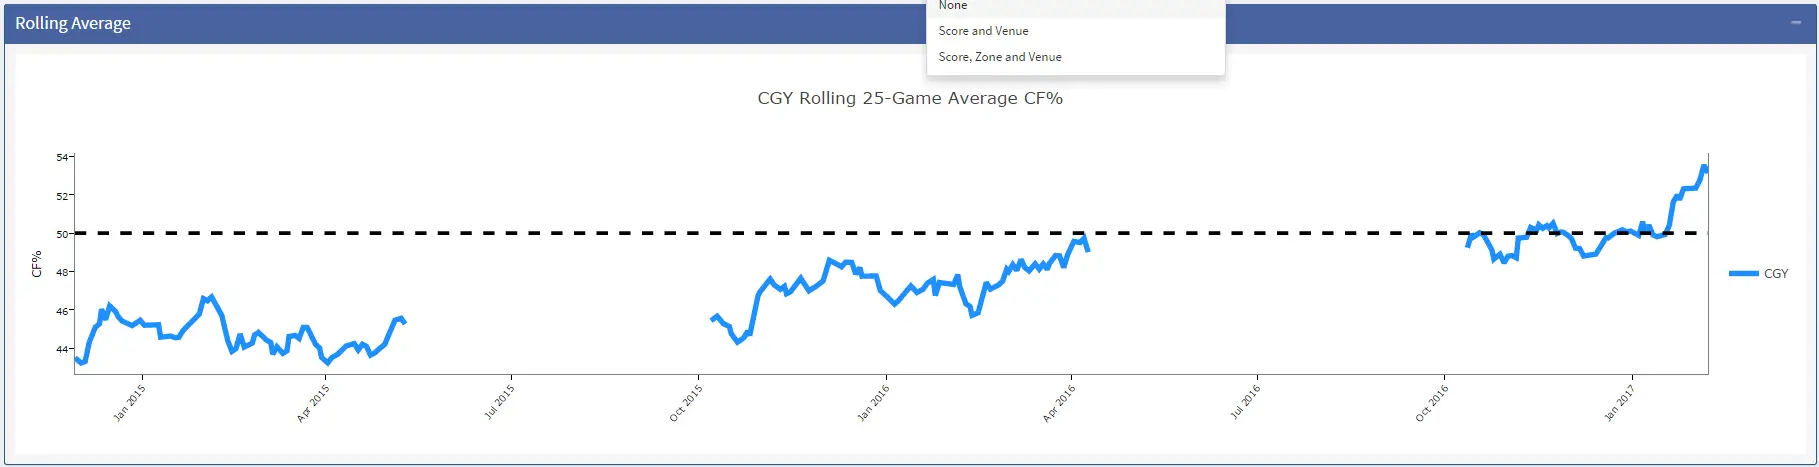 (Courtesy Corisca Hockey)
The 14/15 team was mired in a constant puck losing battle, rolling through the season at about 46%. The 15/16 Flames made a 2% improvement, including a solid late push by the team when they were all but eliminated. Then this year’s team steps in at roughly 50%, has the odd dip in play, but then finds consistency and appears to really find it in 2017.
However, an image like this really only creates more questions rather than provide actual answers. It’s a good summary, but it doesn’t get into the meat and potatoes of what is really going on.
You hear a dialogue all the time … “Sure they have shot attempts, but from where?” suggesting the Flames are lining up at center ice and rifling pucks on net, never getting anywhere close to an opposition goaltender. Their PDO (save percentage and shooting percentage) is very low suggesting they are unlucky, but that turns to “they’re probably giving up point blank shots while not actually generating any blue chip chances of their own”, a valid concern and query.
First lets take a look at the three Calgary Flames teams.
Shots on Goal
The 14/15 Flames had 1780 shots on goal, good for 22 per game on average, but gave up 2045 shots against, for a season total of 265 more shots against. The were accurate though as they scored on 9.3% of their shots while getting scored on only 7.8% of the time. This was thrust behind the well discussed lofty PDO of 101.5 last season.
The 15/16 Flames had 146 more shots on the season and gave up 100 less, coming in with only 19 more shots against than for, a huge important. Their percentages were terrible however, as they were down 1.2% in shooting percentage and their goalie save percentage was rocked by 1.1%, their PDO falling down to 99.2, or under the luck line.
From a shot standpoint the Flames were a better team in 15/16, something the standings wouldn’t reflect whatsoever.
With Glen Gulutzan in charge, the Flames are continuing to add to that positive trend. They are on pace for 1915 shots for, down 11 shots from last year, but still up 135 from the playoff team of two years ago. In terms of team defense they are on pace to give up 1784 shots down an eye popping 162 shots from 15/16 team and 262 shots from the 14/15 team. That’s a huge improvement in their own zone. If you believe the meaning of the PDO stat, the 16/17 teams is very unfortunate in that their shooting percentage is well below the league average of 8.9%, sitting at 6.8%. Over the course of a season, that 2.1% would amount to 40 goals over an 82 game schedule, and likely lead to several more wins.
But this is just shots on goal, and as stated above it doesn’t provide enough colour when it comes to whether or not a team is generating good shots, or just throwing the puck away from all angles.
So for that we look at the three Flames teams again, but this time in terms of scoring chances, which the league defines as shots from within the home plate area of the ice.
The 14/15 Flames had 833 scoring chances, but were very good on converting as they hit on 15.8% of their chances, a good 2% above the league average. They gave up 991 scoring chances however, 158 more than they generated themselves, roughly 2 per game as an average. Their goaltending was above average in stopping home plate chances though, stopping 87.8% of the opposition chances given the Flames a Home plate PDO of 1.036 which is staggering. Outplayed, but beating the averages on both sides of the puck.
In 15/16 the Flames generated 103 more scoring chances for and gave up 64 less scoring chances, ending the season +9 instead of the previous year’s -158. They weren’t as fortunate, but still above average converting on 14.2% of their chances, but the goaltending was the real story as they were 2 points below average, turning away only 84.7% of opposition chances in the home plate area. It won’t come as a surprise but the team was sunk by goaltending.
This year under Gulutzan the Flames are on pace for 833 scoring chances, down 103 from last season, but have prevented 98 more against, giving a similar balance as last year, sitting at +4. The shooting percentage has fallen off significantly though shooting at only 12%, while the goaltending has remained spotty, improving by only 3/10 of a point.
So what can we draw from this?
First off the Flames are a different team since November 15th so I’d be curious to see where these final numbers come in compared to the averages to date, I’m guessing things will go more in their favour over the finally 25% of the season.
It would be easy to suggest the Flames don’t have the talent to score goals, but when a club’s shooting percentage is 1.5% from the home plate area it does point to an element of luck holding the team back.
Either way, it’s hard not to see the positive trends in their play in their own zone as they’ve given up 162 less scoring chances against over the course of a season, that’s winning hockey.
The Wild Wild West
Now that we’ve looked at the Flames over the past three seasons, it’s time to get back to the now and look at these metrics against the rest of the West.
Do the Flames deserve to be a bubble team in 9th in the West for the stretch drive? Are they fortunate to be where they are? Or are they unlucky not to be further up the standings?
The Flames are ranked 8th in the west for shots for per game, but 2nd in the West behind only the L.A. Kings for shots against per game. Their shot differential is 3rd in the West at a +1.6. The Oilers are 3rd, 6th and 5th respectively, suggesting both Alberta teams are playing somewhat sustainable playoff level hockey.
In terms of scoring chances the Flames are not getting it done, as they sit 12th in the West at 10.2 per game. Defensively they are pretty sound however as they rank 3rd in the West at 10.1 per game, behind only Nashville and Los Angeles. As a differential of 0.1, the Flames are ranked 8th, right on the bubble and essentially right where they are. The Oilers are a bit of a tire fire in their own zone 12th in scoring chances against, but a respectable 6th in scoring chance differential.
Clearly the Flames have made big strides defensively, but need to get it going on the attack.
Once again however the shooting percentage is the glaring issue for the Flames. They are ranked 12th in the West in outright shooting percentage at 6.8% compared to the West average of 7.6%. On scoring chances the Flames also are ranked 11th in shooting percentage at 12%, the conference average at 13.2%.
Another drill down is scoring chance average distance; maybe the Flames are shooting from the out reaches of the home plate compared to right in front of the cage. However when you look at average shot distance the Flames actually have the third best distance in the conference at 19.3 feet, compared to the conference average of 20.3. The Flames are not shooting from too far out.
On the goaltending side the Flames are ranked 11th in both overall save percentage and scoring chance save percentage, once again suggesting the tenders just aren’t getting it done.
So what if any conclusions can we draw from this?
Well to be consistent you have to think it’s a very good sign for the organization both for the stretch drive this year and as they head into subsequent seasons. All the metrics that pointed to their inability to sustain their play from two years ago are suggesting just the opposite for this year’s team. They are giving up fewer scoring chances and shots, while maintaining similar totals from both on the attack. As a team they have what experts would call unsustainably low shooting percentage and save percentage, suggesting both should move towards the mean in the final 1/4 of the season.
Every argument that made Calgarians cringe two years ago are the very same that should add optimism this time around.
The Calgary Flames look to be due for a bounce or two down the stretch drive; should be fun to watch!